Data Visualization, Spring 2015
Now that we have a data set of all schools in Texas and their location, we can match that up to just about any other campus-level data set from the Texas Education Agency. (This video explains how to do what we are outlining below, but with different data:)
We are going to do this for STAAR Postsecondary Readiness Standard (All Grades)
We are going to start by pulling the most recent data from the TEA:
As of January, 2015, this was 2013-14 Texas Academic Performance Reports:
- Choose Campus download
- Select Continue to confirm you are downloading all campuses
- Find in the list STAAR Postsecondary Readiness Standard (All Grades), select it and Continue.
- To keep things simple, we'll pull only one data set: Postsecondary Readiness Standard, Two or More Subjects, 2014. Select that, and then click Download.
- You will also need the reference file there, STAAR Postsecondary Readiness Standard (All Grades) Reference, so you can tell what the column headers are.
The file downloaded is called CSTAAR5.xls. It's a pretty big file … about 4M. Go ahead and open it up in Excel and take a look at it, and maybe saveas a .xlsx file. The first column is CAMPUS. Looks amazingly like the SchoolNumber from our school file, even with the single apostrophe to begin that field.
But notice there is no other identifying information in this file. No school name or address or anything? How can we tell what school we are looking at? That CAMPUS column is the key. We'll match that to our school list. Name this worksheet CSTAAR.
Create a new worksheet in the CSTAAR5 file. Now download and open the completed geocoded address file: We'll use this AISD School file. (Or, if we have the full state from our geocoding lesson ready, we'll use that.) Select all and copy that entire file and then paste it into the blank worksheet in the CSTAAR5 file. Name that worksheet "Schools". Save the .xlsx file.
Now we can go into Tableau and connect to the CSTAAR file. Stop at the connections screen.
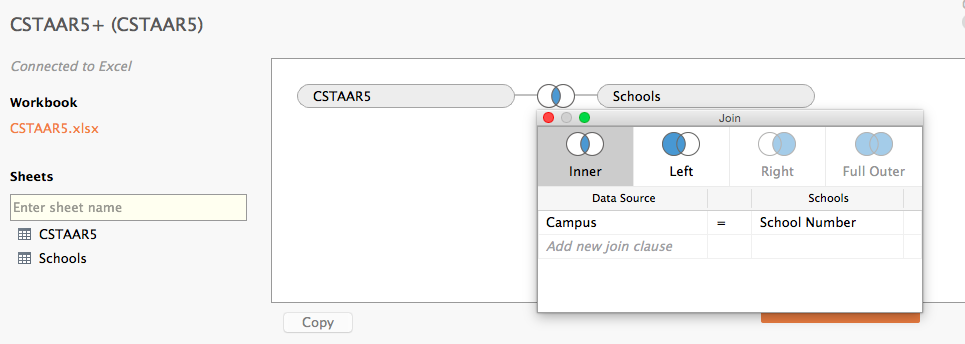
Take the CSTAAR5 sheet and drag onto the connection palette. Then when you take the Schools sheet and drag it over, you'll get a connect box, something similar to above.
The first thing to consider is how you want to join the files: Inner, Left, Right or Full Outer. The diagrams help you figure this out … do you want just the records that match on your key in both files? Or do you want all the records from one file and only the matching data from the other? We're going to use Inner for matching records. In our case, a score without a campus name wouldn't be useful for us.
The next thing is to match up the fields that the two will match on. From Data Source, choose the "Campus" field, and from Schools choose "SchoolNumber."
Now, in the data explorer you can explore the data columns all the way to the right and see that the school data has been added to the CSTAAR5 data where there was a match.
Now you can click the Go to Worksheet button and start work on your visualization.
A couple of things about this data:
- Because TEA uses periods and other non-numbers to code the data, all of the STAAR readiness came in as a string.
- The . means there is no data for that value for that school.
- -1 means there was too little data to report it and preserve privacy, by law.
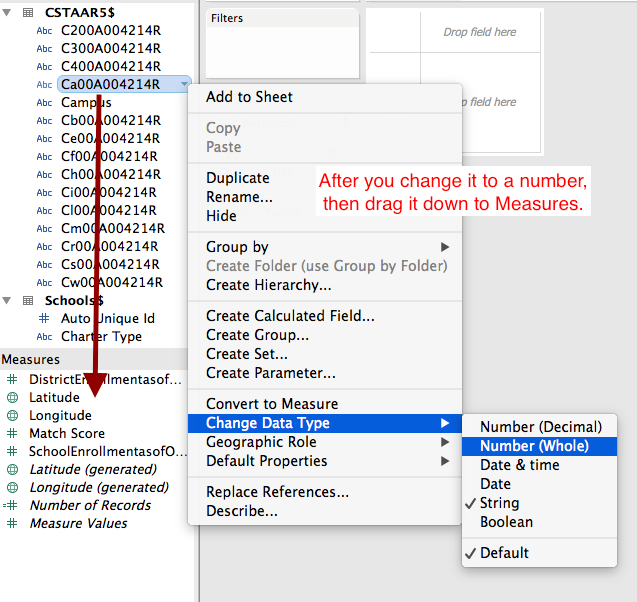
- We won't be able to use these numbers as values until we convert them to numbers and move them to measures.
- Choose the little dropdown on Ca00A004214R > Change Data Type > Number (Whole).
- Once that is done, drag the field from Dimensions to Measures.
There is another way to handle this. You could blank out all the cells with . or -1 in the Excel file and then pull all the data in again. Tableau will then just see numbers
Of course, you'll notice when you start playing with this data that it isn't shaped very well.

0 comments:
Post a Comment
Note: Only a member of this blog may post a comment.