Monday, March 23, 2015

Using importHTML to scrape websites

This is a quick post to show how you can scrape data from websites using Google Spreadsheets. (There are ways to do this in Excel as well).

Let's start with the page, this table of rushing stats on NFL.com. The fact that it is tabular data gives us hope we can scrape it.

Start a new spreadsheet in Google Docs. Go to the first cell and put in this formula:

=IMPORTHTML("http://www.nfl.com/stats/categorystats?tabSeq=0&statisticCategory=RUSHING&conference=null&season=2014&seasonType=POST&d-447263-s=RUSHING_YARDS&d-447263-o=2&d-447263-n=1","table",1)

The function you are calling is IMPORTHTML and it takes three arguments:

  • URL: This is the url you are pulling from. It needs to be in quotes.
  • QUERY: If you are looking for a table or a list. This refers to the HTML of the page. In our case, it is a table, so it is looking for the <table> tag in the code. This should be in quotes. "list" is your other option.
  • INDEX: This is which table on the page. We started with 1 and found it, but some pages might have more than one table on the page. If you put in the number 2 it would look for the second table on the page.
What you get in return is all the tabbed material getting pulled into your page. It is tied to the formula, so if you want to keep it or don't want it to change, copy the content and paste special as values.


Not every page will work, but it is simple enough to try. There are plenty of other discussions on the web about this function, so you can search if you have trouble.

Wednesday, March 11, 2015

Batch geocoding with Texas A&M geocoding service

Data Visualization, Spring 2015


For our Spring 2015 class project, we geocoded every school in Texas. The files are available for free use here: https://github.com/utdata/texas-schools

This is an edited version of the notes for class. Some of it may be discombobulated due to editing around the project. Forgive me.

------

Texas A&M Geoservices offers a (mostly) free, awesome batch geocoding application, including step-by-step instructions on how to use it.


We started with the TEA's list of schools throughout the state (Download School and District File with Site Address), which I found here: http://mansfield.tea.state.tx.us/tea.askted.web/Forms/Home.aspx.

The entire file is available here. I split it into pieces and gave each student a file, which they used for the following steps.

  • Start by converting your source material to a .csv file if it isn't already. (You should be good if you saved the file from github as I asked.) There is one thing to watch here: The school and district number fields start with a ' because some of these numbers start with zeros. If you lose that quote mark and the field turns into numbers, you will not be able to match the data laster.
  • Log in or register
  • Since you are starting a new project, select "Upload a new database"
  • Choose your file type, and then go browse to your file
  • Upload the file
  • Validate the file
  • Review the upload, and then choose Geocoding
  • Go to the next step where you choose which fields are what.
    • StreetAddress needs to be SchoolSiteStreetAddress (NOT SchoolStreetAddress)
    • City needs to be SchoolSiteCity
    • and so on.
    • Leave the other defaults checkmarks as-is
  • Start the process.


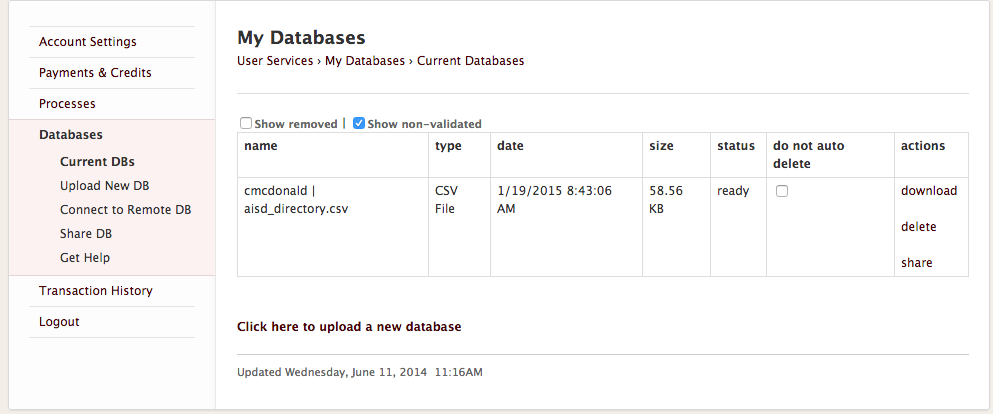
You will get an email when your process is completed. There is a link there that will take you to a page like this where you can download:


Screen Shot 2015-01-19 at 8.54.56 AM.png
The file you download will be the one you uploaded, but with 28 new columns added. We will keep all of the fields, but the ones are are interested in are:


  • GeocodeQualityType
  • Latitude
  • Longitude


The GeocodeQualityType tells us the method used to match the address. It ranges from finding the exact parcel (good!) to finding the exact state (not good! That's not very specific for finding a school.) Most frequently you will see:
  • ExactParcelCentroidPoint: This is good. It found the exact land parcel.
  • AddressRangeInterpolation: This is OK. It found a close approximation based of the address. We can look at the MatchScore to see how close it was, but we'll just leave as is for now.
  • USPSZipAreaCentroid: This is bad for us. It might have found a 100% match, but it is only based on the center of the ZIP code, so it may not be anywhere near the school. We will have to manually code this address for any accuracy.
  • You might also see City or State centroids, which are also bad. Basically anything but the first two are bad.


What to do if they are bad? Manually find them in Google Maps, if you can. If you do update the Lat/Long manually, then change this value to "Manual" so we know it has updated. If you can't find it, leave it be so we know it is still bad.


Fixing bad addresses

We'll use this file of AISD results as an example to talk about fixing addresses. (You should use your own file from the geocoding service)


Of the 131 addresses I submitted to the geocoder, 16 of them are USPSZipAreaCentroid and need to be manually coded. That's 8%. If that percentage holds state-wide, then you can expect about 40 manual codings out of your 500+. Probably more if you have rural schools. It's not hard, though.


  • Now that you've got your addresses back, you can save-as on the file and make it an .xlsx file.
  • Filter your data on GeocodeQualityType for your bad addresses.
  • You might want to hide columns between SchoolSiteZip and GeoCodeQualityType so you can see the name and address of the school along with your Lat/Long as you work. (Control-click on the column letter, then choose "Hide")
  • Go to Google Maps and put your school name and address into the search bar and see if you can find it. (If you find you have a problem with the "What's here" funcitonality, try Classic Google Maps. It works mo betta.)
    • If you have trouble, you might try spelling out Elementary, etc.
    • If you can't find by name, try typing in the School Site Address
  • Once you find it, Zoom in to the 500ft or 200ft level if you aren't already.
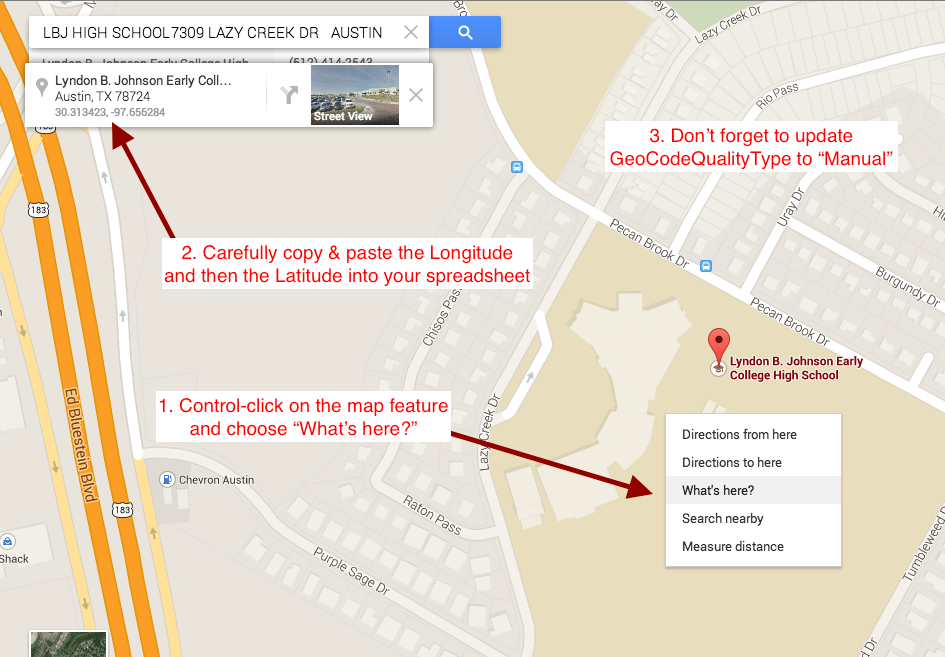
  • Control-click on the map right on top of the school, and choose "What's here". This will put a box at the top left of the map that includes the Latitude and Longitude. (Screenshot below)
  • Copy and paste those values back into the spreadsheet, then update the GeocodeQualityType to "Manual" for that record. DO THIS CAREFULLY. You are creating data for the world … do it right.
  • Rinse and repeat for all your bad addresses.
  • If you just can't find it, leave it as the Zip or City centroid, but take note of it.
  • Submit your finished file to the Canvas assignment. Note any issues you had, like how many schools you could not find at all.


Screen Shot 2015-01-19 at 9.40.40 AM.png

Google Fusion Tables choropleth map

Data Visualization, Spring 2015
(A bit of a work in progress …)


Our goal is to make a choropleth map much like this one below, based on U.S. Census Bureau data, which you can then embed in a blog post or web page.


gft-finishedmap.png


First, you need your Census Table data source. The spreadsheet needs to be well formatted with a single header row and no extra cruft at the bottom of the file. For this example, we’ll use some Percent Civilian Unemployed XLS from the 2013 1-Year ACS, table DP03. Download that Excel spreadsheet to your computer.


You will need a Google Drive account that is NOT connected to UT-Austin. They don't allow use of the Fusion Tables app.

Upload your data

  • In drive, click on New, go down to More and then choose Google Fusion Tables. If you’ve never done this before, you will first have to click the “Connect more apps” link there, search for “Fusion Tables” and connect before trying again.


newgft.png


  • Next, you will browse to the file you are uploading. You can use an Excel spreadsheet, delimited text file, or even a Google Spreadsheet link. For this example, we’ll click Choose File and find our file ACS_13_1YR_DP03.xlsx, and then click next.
gft-choosefile.png


  • Next, you will get a little preview of your data. Click Next.


gft-inserttable.png


  • Your file should now be uploaded and your should see your data like below:


gft-thedata.png


Finding your data again

That will take you to a list of all your tables and allow you to search for public tables. It is not an easy place to find by searching and clicking around.


Find your geography

When you upload data, GFT will sometimes sniff out that one of your columns is a city, country or other geography and highlight it in yellow. It might even create a map on another tab. For this lesson, however, we want to merge our data to a specific shapefile of all the counties in Texas, and it is already available as a public file in Fusion Tables.


There are many public shapefiles saved into Fusion Tables, and you can search for them. The one we want for this exercise is named Texas County Shapefile (utdataviz). Click on that link to open it. (To save a new shapefile to GFT, see “Uploading shapefiles” below.)

The merge overview

Before go further, let’s outline all the steps to merge files, then we’ll go over them in detail:
  • Have both your data file and your shapefile open in Fusion Tables
  • Decide if you want all your date, or all your shapes, and then start with that file.
  • Merge in your new file, creating the new combined file.
  • Style your features and info windows.
  • Publish and then share or embed as necessary.

Choosing the correct file to start with

Sometimes you don’t have data for every feature in your shapefile. In our example, we have a table of 53 counties of data, but there are 254 counties in the state. In other words, we don’t have every county. (This is a common occurrence when using ACS data. The other counties apparently didn’t have a sample size large enough to be viable for inclusion.) So we have to decide: Do we want to start with all our data and then combine the just to the shapes that have a match? Or do we want to start with all our counties, and pull in just the data that have matches.


What’s the difference? If we start with our data, the missing counties will be absent. If we start with our counties, we’ll have the shape for every county, but the those missing data will show in the default red color. The answer depends on your goal.


For this lesson, we’ll start with the data of the ACS_13_1YR_DP03 table.


Merging

Go ahead and open both your ACS_13_1YR_DP03 data file (Here is my copy) and your Texas County Shapefile in seperate tabs. Compare the two and find the key that is common to both. The column Id2 in the data file matches with column GEOID10 in the shapefile. Connect these fields, and you have a merge.


From your data file, go under File to Merge and you’ll get this window:


gtf-mergeprompt.png


You can search for the table you need, or since you followed the directions above, you already have it open so you can copy and paste the url in the web address field at the bottom.


gft-matchcolumns.png


You’ll notice the numbers themselves don’t actually match across the files in this window … it is just showing you a preview of what some of those cells look like so you can see if they are similar. The will match once you hit Next … which you should do now.


gtf-savemergedcols.png


Here have a chance to include or not include particular columns that may not be of interest in this merge. Click Merge to complete it.


gft-newmergedfile.png


This is a good time to note that you will be creating a NEW file based on these other two, and that they are all linked together. Changes made to the original data or shape files will be transferred/reflected in this merged combination. (I need to check on this behavior.)

The new merged table

Now you have a new Google Fusion table, and there has been a tab added called Map of Geometry. It shows only the counties that you have in your data. Now we’ll get to color the shading of the shapes, and choose what is in the pop-up.


gft-newmergedmap.png


Change feature styles

Click on the “Change feature styles” button and you’ll get a window like this:


gft-changestyles.png


We are filling the polygons based from a “bucket” of the data, in our case using the percent unemployed in the civilian labor force.
  • Choose how many buckets you want.
  • Choose the field to pull from
  • Change the values and colors to make sense.
    • Usually I can click on “use this range” to split the buckets evenly, but in this case GFT wouldn’t do it. One of the reasons I’ve quit using it much.


Also note in the window Legend > Automatic legend. You can go there and choose to “Show polygon fill legend.” There isn’t any customization beyond the name, unfortunately.

Adjust your info windows

Click on the “Change infor window” and you’ll have the option of choosing which fields to show in the window:
gft-changeinfowindow.png


But if you then click on the Custom link, you can use some basic HTML to change this info window around. (I’ve put in images, tables and Google Charts into these windows.) In this case, we’ll just clean up the field names:


gft-changeinfocustom.png

Publish your mapgft-publish.png

  • Go to the share button at top right and change the visibility to either “Public on the web” or “Anyone with the link” can View the worksheet.
  • I renamed my “Map of geography” field to “Unemployment” by clicking on the menu and choosing rename. Then to publish your map, but under that same dropdown to Publish.
  • You then get a screen where you can get a link to share your project, or embed code put your blog on a website or blog.


gft-embed.png
There are many options there to use, but here are some hints:
  • If you send someone a link to you map, use this link on this Publish page from the map, not the url to the table. The public presentation is nicer than looking at the table view.
  • If you are going to embed, look at the width and height. iframe should work on most sites.


Some hints about saving data from American Factfinder

Google Fusion Tables can be picky about non-numbers being in number fields, so you might follow these steps when downloading Census data.
  • Find the table you want click on it so you are at the Table View and can see examples of your data.
  • Click on the download button. When you get the pop-up, choose to save a CSV file, with “Data and annotations in separate files.”
  • You’ll use the file that ends in “.csv” that does NOT have “_ann” in the name.
  • Clean up your data so you have one header row that you can read and understand. Make sure you keep the id numbers so you can match to a shapefile later.
  • If you end up saving the data as a spreadsheet, and adding more sheets to it, just make sure that the data you want to load is on the first sheet in the Workbook.


Uploading shapefiles

Google Fusion Tables does not take the most common .shp file format that you get from ArcGIS. It instead uses the .kml files (Keyhole Markup Files). More and more sites supply a .kml, too, but you might have to convert many of your .shp file to.kml. There are several ways:
  • We’ll learn to do this with free QGIS later in the semester.
  • You can upload to shpescape.com, which is also free, but often backed up.
  • There are some command-line tools ogr2ogr, but you have to know what your are doing both with shapefiles and the command-line.


Other useful Google Fusion Table shapefiles already uploaded:

Wednesday, February 18, 2015

Data cleaning with Regular Expressions

Regular expressions (or regex for short) is a programming language used to match patterns and is very useful to search and parse data. This lesson is just an introduction to a very powerful programming skill. We’ll be using the Regex Cheat Sheet. Download a copy for yourself.
  • Download the file regex-OpiodDrugs and open it using Text Wrangler or code editor of your choice. Notepad++ is a decent PC one.
    • This is a list of drugs and their dosage that were in a single column in Excel. We want to split this into three different fields: Drug, Amount, Type.
    • You couldn’t do a simple search and replace to separate these … the combinations are too complex. We need MORE POWA!
    • We’ll do this by creating three groups of patterns using Regex, and then we will replace those patterns putting a tab in between so we have have different columns.
  • Copy the contents of OpiodDrugs.
  • Go to http://regex101.com/ and paste the contents into the “TEST STRING” field.
    • We will put our expression in the top REGULAR EXPRESSION field. As we create groups, they will be displayed in the MATCH INFORMATION on the right.
    • Since we will be using this on an entire file, we need to add some modifiers in the field after the "/" in REGULAR EXPRESSION. Add "gm", which means "global" and "multi-line".
  • Capturing the Drug
    • We know that the drug is always at the beginning of the string, so we will put in the character for that: ^
    • We know we want our drug name as a group so we will put in parenthesis to hold them: ^()
    • We know we want to grab certain types of characters, mainly letters, so we are going to build an expression inside brackets to say why type of characters we want. In fact, we want everything until we find a number, which starts the Amount part of the string. So, we’ll fill that bracket with the kinds of characters we need. Start with the brackets: ^([])
    • We know we only have uppercase letters, so we’ll start with A-Z. That means anything between the uppercase A and the uppercase Z: ^([A-Z])
    • Well, that got the first character. We need more of them, so let’s use the * to get "zero or more of".: ^([A-Z]*)
    • Take a minute to look over at the MATCH INFORMATION. This is where you’ll see our progress in making our groups.
    • That got the first word of each drug, but some drugs have a slash between them, and we need them both. Slashes are special characters in Regex because they can be a command, too. As such we have to “escape” the slash to let Regex know we are talking about the piece of text and not a command. You do that with a backslash. So, we’ll add the escaped slash to our brackets: ^([A-Z\/]*)
    • We’re almost there. We have one drug, the FENTANYL TRANSDERMAL PATCH that has spaces. In fact, the TRANSDERMAL PATCH part of that is probably a “Type” like TABLET, but I think we’ll have to deal with that later. We’re going to add a space to our character brackets so we can keep this in our Drug group: ^([A-Z\/ ]*)
  • Capturing the Amount
    • Looking at this, our amount always have numbers, and then some characters that follow it, until you get to a space. So, if we can grab all those combinations to a space, we’ll be golden. We can also deal with the space between the groups so we don't include them in our group.
    • We’ll start by creating our new group with new parenthesis: ^([A-Z\/ ]*) ()
    • Now we’ll add our first character class, which are numbers. It could be any number from 0-9. We put them in the character brackets: ^([A-Z\/ ]*) ([0-9])
    • OK, with the last one, we got a single number, but we need more than one, we we’ll add the * to catch “zero or more”: ^([A-Z\/ ]*) ([0-9]*)
    • OK, we now we need to grap the slash, which we have to escape again with the backslash. Let’s add it: ^([A-Z\/ ]*) ([0-9\/]*)
    • Now we need to get the series of letters for the amount. We could put in just the characters we need - MCGHR - but we’ll go ahead and grab all uppercase letters: ^([A-Z\/ ]*) ([0-9\/A-Z]*)
    • We got all the amounts!
  • Get the rest: The type
    • Now we need to account for the space between the Amount and the Type, so add your space after. When you do, look what happens to Match 30 and 31. We lost our Amount there ... why? Because that group does not have a space after it. We can account for that with the * command, which is for "zero or more of".
    • OK, we’re going to start our third group by adding some parentheses.: ^([A-Z\/ ]*) ([0-9\/A-Z]*) *()
    • We know we need just uppercase letters, so let’s add those in our character brackets: ^([A-Z\/ ]*) ([0-9\/A-Z]*) *([A-Z])
    • Make sure to check all your groups, because Match 30 & 31 are problematic again. Add our * and we are good: ^([A-Z \/]*) ([0-9\/A-Z]*) *([A-Z]*)
    • We’re almost there. We need to account for the spaces and commas, so we'll add both of those in the brackets: ^([A-Z \/]*) ([0-9\/A-Z]*) *([A-Z ,]*)
  • So now we’ve captured all our content and we are storing them into three groups. We’ll be able to reference that group in a search and replace in Text Wrangler.
    • Copy your Regular Expression from regex101 and then go over Text Wrangler and open the Opiods file if you haven’t already.
    • Do Cmd-F to open the find and replace window. In the Find section, paste in your Regular Expression.
    • In your replace section we will reference our groups using \1 for the first group, and \2 for the second, etc. In between these groups, we have to put a tab, which is a command character written as \t. So the replace field will look like this: \1\t\2\t\3
    • Once last thing, on matching you have to click the GREP button so the search and replace will recognize you are using Regular Expressions.
    • Hit Replace All, and you’ll end up with tabs where you want them. Copy and paste it into Excel so you can see.
  • So, there you have it … your data in separate fields. You will need to run TRIM on those columns as we didn't get quite all spaces, but it's a start.

Rubular.com is the regex tester I've used in the past that has a simplier interface, but I like the colors in regex101.

We actually wrote a longer expression than we had to, but did so to show the power of the individual characters. This string below would do the same thing … can you use your handout of common regex functions to figure out how?

^([\D]*) ([\w\/]*) *(.*)

compared to:
^([A-Z \/]*) ([0-9\/A-Z]*) *([A-Z ,]*)

We still have to trip the drug names because of extra spaces. There is probably a way around that, too.